Gold price prediction – outline for Fiscal Year 2025 and Beyond.
1. Gold price forecast for 2025, 2026, 2027, 2030
This is the outcome of our gold price prediction analysis outlined in the remainder of this article.
2025
: max gold price right above$3,275.2026: max gold price around$3,800.2027:
max gold price around$4,400.2030: peak gold price prediction $5,050.
The ranges indicated in this summary are estimates produced by research, based on current and predicted intermarket trends and secular gold charts.
Gold’s bullish thesis invalidates once it drops and stays
below $1,770, a very low probability outcome to happen this decade.
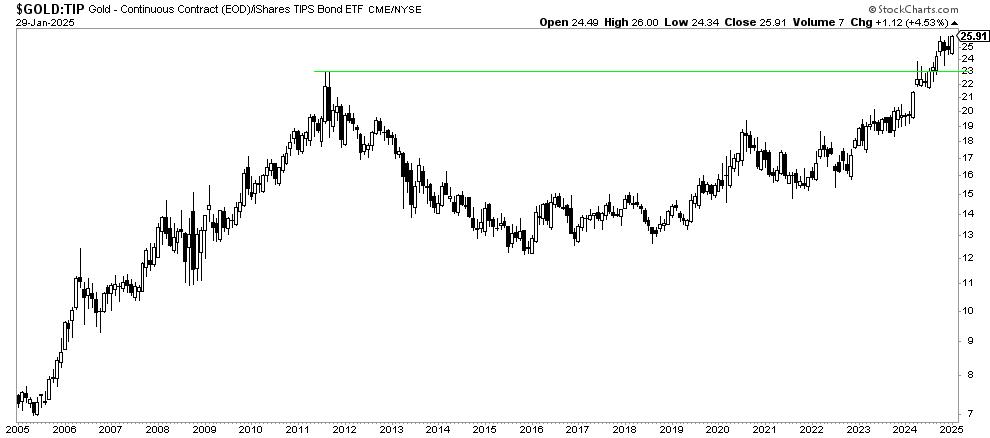
2. Gold price breakout in all world currencies.
Most gold price forecasts are U.S. centric which means gold expressed in USD.
What many investors don’t realize is that gold started setting new all-time highs in each and every global currency as evidenced by this magnificent chart (courtesy of Goldchartsrus).
This process started early 2024. It was the ultimate confirmation of the gold bull market.
The gold price in global currencies is setting new all-time highs since early 2024
3. Gold price charts: long term charts.
We take a top-down approach: from the
50-year gold chart exhibiting dominant secular dynamics to the gold price over 20 years for medium term oriented dynamics.
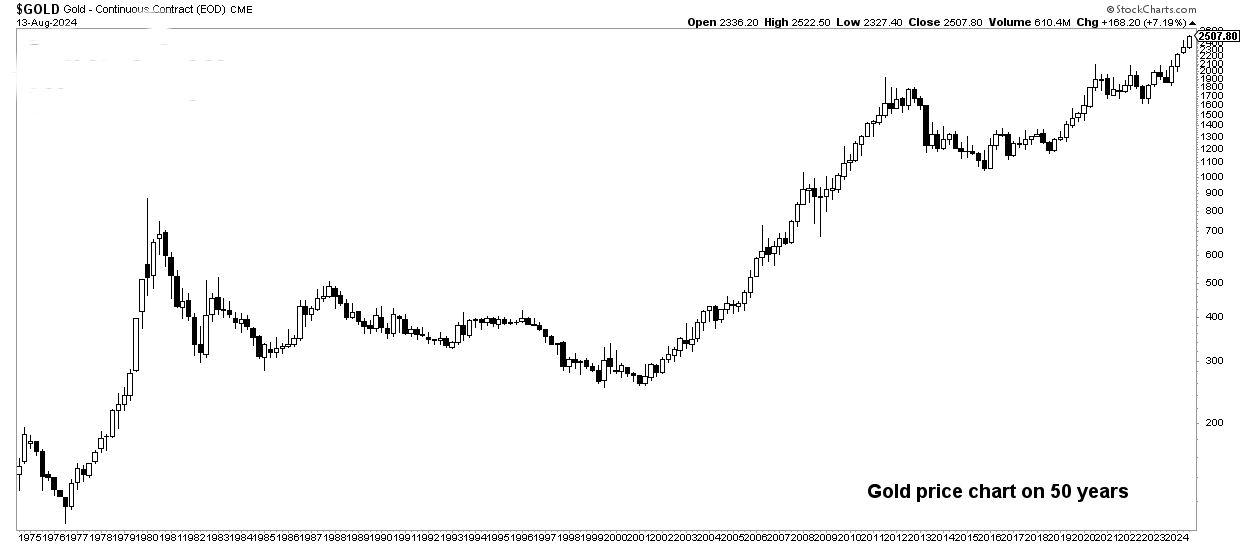
Gold chart over 50 years – the bullish case
The 50-year gold chart in USD shows 2 secular bullish reversal patterns:
In the 80s and 90s – a long falling wedge. This was such a long (hence strong) pattern that the subsequent bull market was unusually long.
Between 2013 and 2023 – a secular cup and handle formation.
The recent 10-year bullish reversal is powerful.
As said, ‘long’ equals ‘strong’ when it comes to consolidations and reversal pattern. This creates a strong argument for a strong gold bull market in the years to come, with a high confidence level.
The secular gold chart suggests that the gold bull market will run over multiple years.
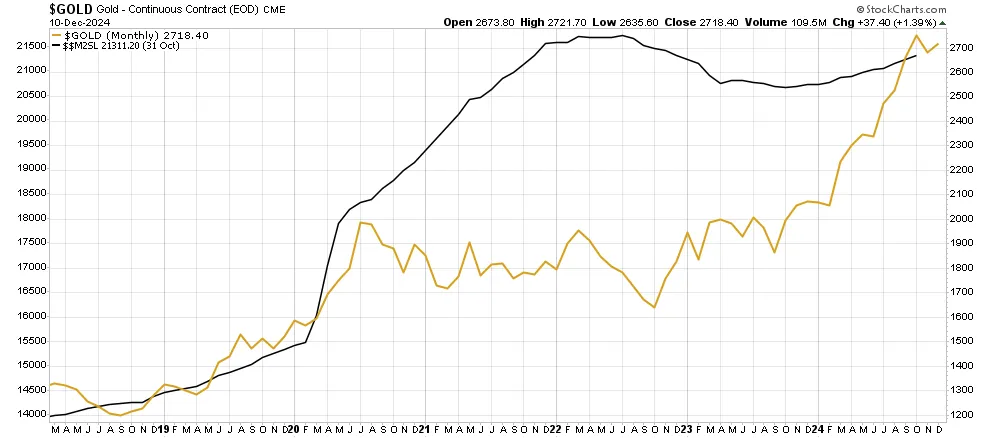
January 1st
The long term gold bull market is confirmed with 3 quarterly candlesticks above former ATH. Gold is officially in a secular bull market.
Only a drop below $2,200 an Ounce for 3 consecutive months (very low probability) will invalidate gold’s bull market thesis.
Gold prediction – a new secular bull market is here!
Gold chart over 50 years – the potential bearish case ( almost invalidated )
The long term gold chart structure shown below has a very different looking compared to the same chart with different annotations shown above:
Below is a rising wedge which by definition is a bearish pattern.
However, this is in contrast to the strongly bullish pattern on the above shown chart.A bearish outcome will occur if gold leaves a large wick on its quarterly candlestick chart (below) similar to the ones in 1980 and 2011.
This is not the likely outcome, as gold only rose 30% after its breakout in April of 2024 (in 1980 and 2011, it went up triple digits before hitting a big top).
We always need to be mindful of the two sides of the trade, no matter how unlikely some outcomes may be.
January 30th
The bearish thesis may or may not materialize. When it comes to the Q4/2025 quarterly candlestick, it closed right at the rising trendline.
More importantly, it did not leave a large wick similar to 1980 and 2011. This implies that the current quarterly candlestick (January to March 2025) will be the decisive candle to invalidate the bearish setup potential of the rising wedge (the potential bearish case).
At the time of updating this article, we see an attempt to completely invalidate and annihilate the bearish wedge pattern.
This is very bullish provided gold trades above $2750 by March 31st, 2025!
Quick Links
Home
About Us
Services
Useful Links
Testimonials
FAQs
Blog